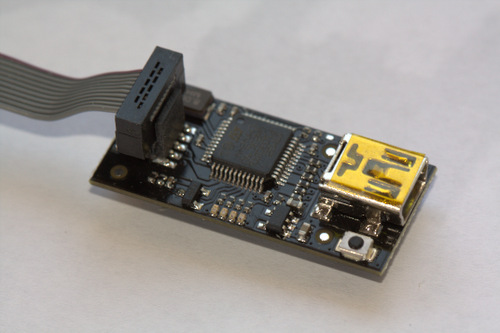
The Black Sphere Debugger is a modern, in-application debugging tool for embedded microprocessors. It allows you see what is going on ‘inside’ an application running on an embedded microprocessor while it executes. It currently supports the STM32, LM3S and LPC11xx families of ARM Cortex-M based microcontrollers. The hardware design and firmware source code are available under open-source licenses.
It is able to control and examine the state of the target microprocessor using a JTAG or SWD (Serial Wire Debugging) port and on-chip debug logic provided by the microprocessor. The probe connects to a host computer using a standard USB interface. The user is able to control exactly what happens using the GNU source level debugging software, GDB.
A standard USB serial (COM) port is supplied by the debugger that is ideal for debugging messages or communication with the target program. Black Sphere Debugger is particularly suited to automation, ATE, and test applications in a production environment.
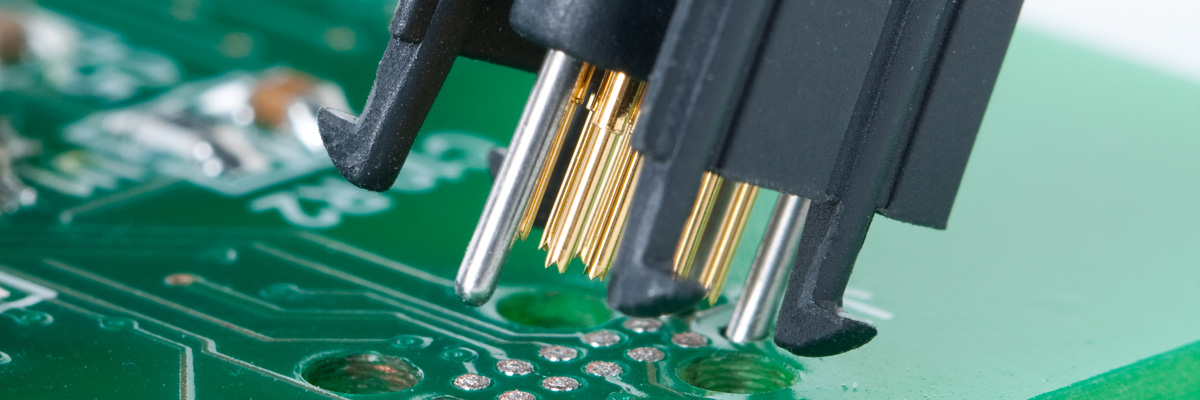
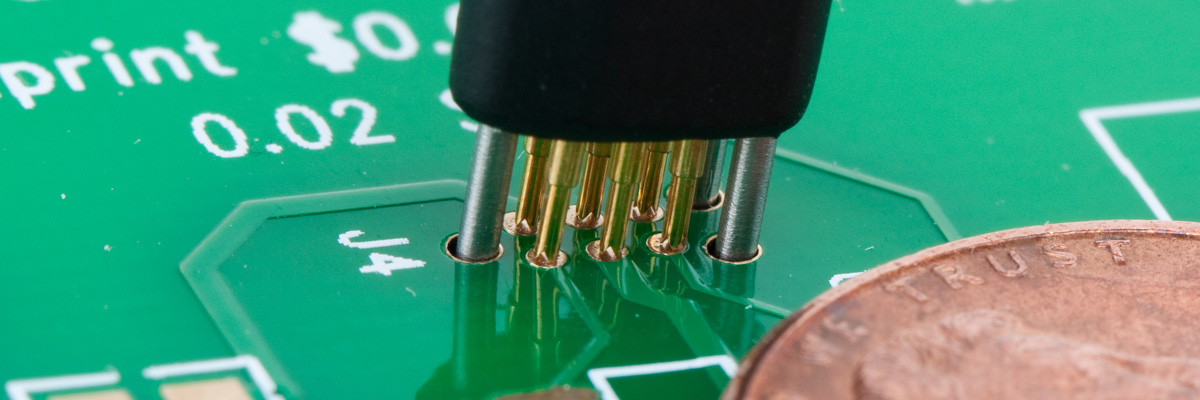
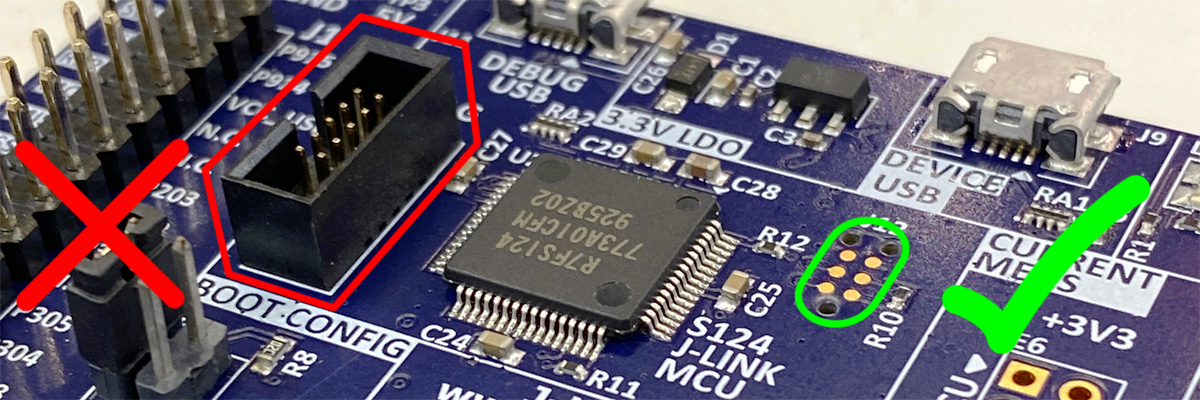
Tag-Connect™ replacement debug/programming cables save cost and space on every board!
Use Black Sphere Debugger with our space-saving TC2030-CTX and TC2030-CTX-NL Plug-of-Nails Cables or if you must, use with a standard Cortex 10-pin ribbon cable.
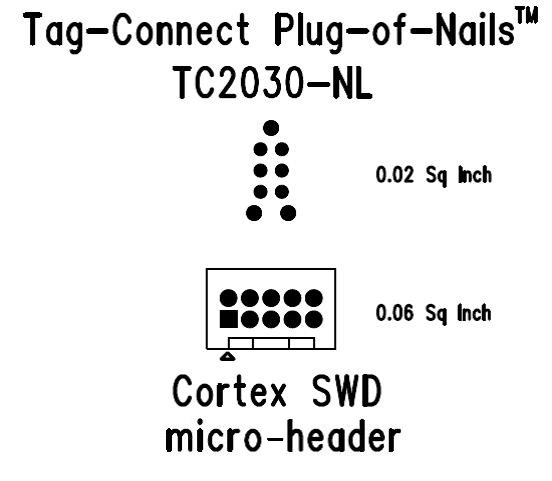

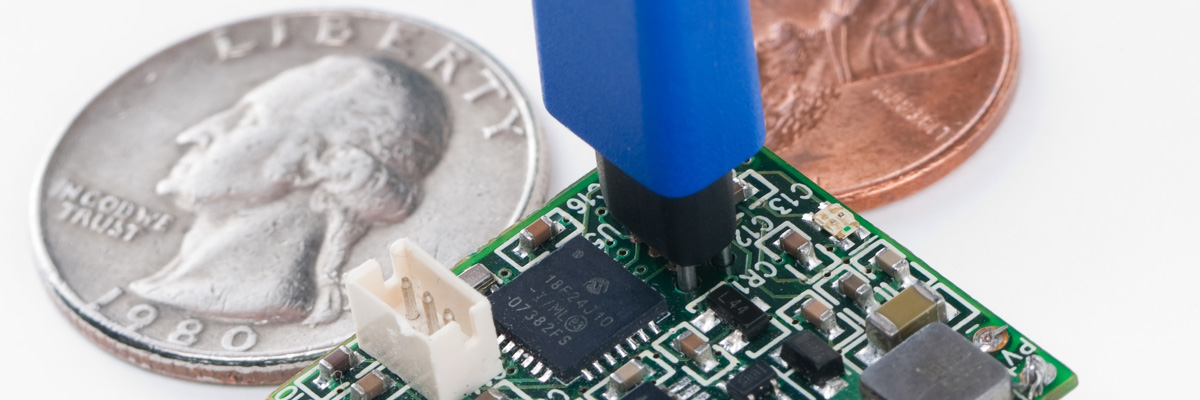
Footprint Space Comparison 66% Saving on the TC2030-CTX. Versus the ARM 20-pin, the TC2030-CTX has an 84% Saving on space.
Connect your TC2030-CTX cable straight into the Black Sphere Debugger and start debugging!
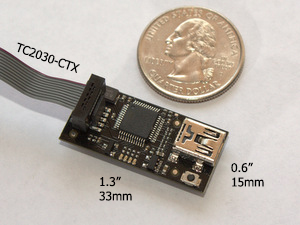
Above shows Black Sphere Debugger with a USA Quarter dollar coin.
The TC2030-CTX cables suiatble for use with Black Sphere Debugger come in both “legged” and “no-leg” versions. View the datasheet:
The TC2030-CTX-NL will require the TC2030-CLIP if you want a hands-free solution while debugging.

